Thursday 28 February 2013

Entering Volatility Globally......


Stability breeds Instability and Warning always occur before Instability....

O Ashuji....

One of the greatest work (not that I have read many) in study of volatility and price behavior has been done by Benoit  Mandelbrot. His book "The (Mis) Behavior of Markets - A Fractal View of Risk, Ruin and Reward" is a must read for anyone who wants understand nature of price behavior in asset markets. Second last chapter in the book discusses - The Heresies of Finance. The one I found most powerful is -- Forecasting Prices May Be Perilious, but You Can Estimate the Odds of Future Volatility. I will quote from the book...

" The data overwhelmingly show that the magnitude of price changes depends on those of the past, and that the bell curve is a non-sense. Speaking Mathematically, markets can exhibit dependence without correlation. The key to this paradox lies in the distinction between the size and the direction of price changes. Suppose that the direction is uncorrelated with the past : The fact that prices fell yesterday does not make them more likely to fall today. It remains possible for the absolute changes to be dependent : A 10% fall yesterday may well increase the odds of another 10% move today - but provide no advance way of telling whether it will be up or down. If so, the correlation vanishes, in spite of the strong dependence. Large price changes tend to be followed by more large changes, positive or negative. Small changes tend to be followed by more small changes. VOLATILITY CLUSTERS."

For More on Concept of Clustering....
http://www.speculationanart.blogspot.in/2012/12/market-compression-reaches-extreme.html (Dated 26th December 2012)

25 Feb 2013.....Beginning of Volatility Clustering....!!!

I have discussed many times in past blog that 2012 was the most compressed year for Indian stock markets and many other global markets. Volatility was killed globally by various central bank interventions. In a sense it was clustering of compression. Something which has been calm for long, sudden surge indicates change in behavior. Rupee could be used here as an classic example. Rupee was largely stable between 44-47 (2010 till Aug 2011) for almost 18-19 months. Then between Aug-Sep 2011 it rose from 44 to 49. Basically 19 months range was broken in 2 months. This indicated big change coming. Anyone glued on fundamental would fail to understand or understand this move in hindsight but study of price behavior showed this market had changed. It indeed had and Rupee depreciated sharply between Aug-Dec 2011 and what has happened since then is known. Basically, any historically large move should be paid particular attention.

FUNDAMENTAL UNDERSTANDING CREATES ILLUSION OF CONTROL WHILE PRICE UNDERSTANDING WARNS OF CHANGING BEHAVIOR.

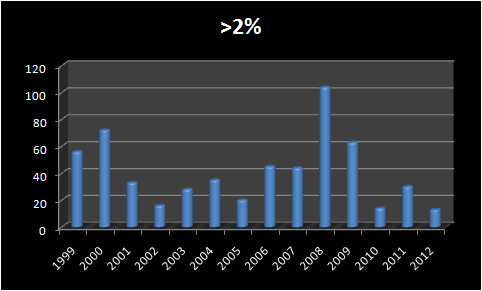
US VIX Spiked 32% on 25th Feb 2013. Since 2004, there have been 11 instances of 30+% VIX spike.


Note: 25 Feb 2013, was the 6th largest spike in VIX since 2004. 
           Since 1990, only 8 times VIX has spiked more than 35%


Analyzing above spikes within context of volatility clustering

Methodology used - Each spikes were analyzed with respect to VIX 2 months prior and 2 months post occurrence of spike i.e Feb 2007 was analzyed with respect to how VIX behaved 2 months prior to Feb 2007 and 2 months post Feb 2007.

1) 27 Feb 2007 VIX spikes 64.3% (highest ever in the history of VIX so far) - VIX range 2 months prior to spike (Jan-Feb 2007) was 10-12. Thus breaking that range or range of even longer prior period with such sharp spike should have warned of volatility. Volatility typically clusters and then subsides. This spike was followed by sharp moves in VIX both on downsides and upsides. But size of moves had certainly changed. within next 11 trading days, VIX had 5 double digit % moves (3 up and 2 down). SO WHAT CHANGED WITH THAT 64% SPIKE MOVE IN VIX....10-12 range became thing of past....12 became base and VIX gradually moved up all through 2007.

2) 29 Sep 2008 and 22 Oct 2008 clustering was right at the middle of Financial Crises.

3) 27 April 2010 sudden spike in VIX was prelude to 6th May 2010 Flash Crash and VIX peaking on same day with VIX falling by 30% on 10th May 2010.

4) 4th, 8th and 18th August 2011 clustering is clearly evident...it then got coupled with EU crises which culminated in last spike of 30+% on 9th Nov 2011.

Conclusion

1) Whenever such historic spike occurred, Volatility clustered. Except for May 2006, wherein VIX level came back to pre-spike level after a month or so, all other instances pre-spike level didn't come for very long time. Pre-Spike became base for VIX. Any Sharp fall in VIX towards pre-spike level immediately resulted in spike in VIX.

2) Volatility clustered and then subsided with VIX at higher levels.

3) 25 Feb 2013, VIX spiked from 14odd to 18.9...If history is any guide and nature of Volatility any VIX move towards 14 should result in spike in VIX towards 19 or higher at least in foreseeable future...


Monday 25 February 2013

Bull Market in Sentiment and Bear Market in Stock Prices


IF IT LOOKS LIKE A BULL....FEELS LIKE A BULL AND SMELLS LIKE A BULL...THEN IT MUST BE BULL SHIT....
O Ashuji....

World equity markets formed a major low on 4th June 2012. Since then most markets have risen remarkably and in very linear and least volatile manner. India's Nifty joined global rally and performed almost in-line with global markets till 2012 end. Government's flurry of reforms announcement and intention improved sentiment far ahead of stock price performance. H2 2012 was welcomed as a start of bull market.

2013 - Market Deforms Amid Government Reforms

Before we get into internals of markets in 2013....I will get into my favorite segment "EXPERT OPINIONS".

Expert Opinions during H2 Dec 2012 and H1 Jan 2013.....


Budget, Guj polls can take Nifty to 6800: Baliga (17th Dec 2012 CNBC)
-- why 6800....why not 7800....bolne ka paisa nahin lagta....

Jan rate cut hopes will drive equity mkt: Axis Direct  (18th Dec 2012, CNBC)
hope has been driving markets and hope will continue to drive...

Risk is in the air; fiscal cliff drag minimal: PN Vijay   (18th Dec 2012, CNBC)
Soon Risk will be in A***

Nifty may see new highs in January: Ambareesh Baliga  (20th Dec 2012, CNBC)

Market may see strong run up to Budget: BofA Merrill Lynch   (20th Dec 2012, CNBC)
Yes....very strong run so far ...with mid cap rising -ve 11% and small rising -ve 9%...

See Santa Claus rally in January this time: PN Vijay  (21st Dec 2012, CNBC)
Santa Claus came in February with mid cap and small cap falling by 9% and 7% respectively....

Sanju Verma sees Sensex at 22K by Mar 2013, suggests bets (24th Dec 2012, CNBC)
Come March 2013....date will change to March 2014 and so on and so forth....target and time is based on convenience.

Nirmal Bang bets on Jan-Feb 2013; says India may be best EM  (24th Dec 2012, CNBC)
Yes...Best EM...even Pakistan beat us....

US, Europe sideshows; domestic boom to rule 2013: PN Vijay  (1st Jan 2013, CNBC)
Domestic stocks boomed with massive rise in small and mid cap stocks....

See more upside in mkt; buy on dips: Siddharth Bhamre   (1st Jan 2013, CNBC)
Again same statement can be applied to anytime in the year...

Budget 2013: Equities to outperform; buy gold ETFs, says Axis Direct  (9th Jan 2013, CNBC)
Gold rose from 1684 (since 9th Jan 2013) to 1591 (now)...thus giving massive -ve 6.5%....

RBI policy action, reforms key trigger for mkt: Dipan Mehta   (11th Jan 2013, CNBC)
Farting by important market participants should also be trigger for market...

Liquidity strong, Nifty heading towards 6150-6200: Bhamre   (15th Jan 2013, CNBC)
Liquidity is second name of ignorance......


Market Internals in 2013....Screaming bull market gains momentum...

With Bullish sentiment...markets "bull-shit" picture gained further momentum in 2013...


Nifty Constituents Performance Since June 2012 lows (% Returns)  


Note: Arranged in order of best peformance during June-Dec 2012, Jan 2013, Feb 2013 and 2013)

If this looks like bull market then bull should wear look of bear....


Salient features of "New Bull Market" since June 2012 lows....Sarcasm is the theme

1) No of stocks outperforming Nifty roared from 22 to 15 as bull market gained momentum with announcement of various reform measures.

2) Stocks with positive returns  continued to make new high as bull market continued into 2013. June-Dec 2012 rally had 44 (out of 50) with positive returns while 2013 had 13 stocks with positive returns.

3) As with start of all major bull market, Mid-Cap and Small Cap outperformed massively to Nifty. Nifty rose 19% since June 2012 lows, while Mid-Cap and Small Cap rose 7% and 6% respectively.

4) All of the above happened with very strong global market and extremely active government.


Conclusions

Nifty continues to be on extremely weak wicket and given weak global set up and high budget hopes....Nifty could finally do...what small-mid caps have done.....


Tuesday 19 February 2013

India Budget and Nifty Moves....Historical Perspective


ZOMBIE MARKET IS BETTER THAN DEAD BECAUSE ZOMBIES ARE VIOLENT.....
O Ashuji....

Nifty has been dead since November 2012 end would understatement. 

Nifty Movement Since November 2012 End....


1) Above table quite clearly highlights what nightmare it has been for a Nifty trader (it includes me). Zombies are better because they tend to be violent.

2) During 55 trading days since November end, Nifty has moved in 3.3% range (on closing basis) and is up 1%. Even a developed market will envy such stability. Nifty's close on 30th November was 5880 and today's close was 5940.

3) Having seen such market, it is no surprise that most "experts" are now calling for range bound market (limited downside and no major upside but bias is still positive). Such sentiments are prevailing at a time when we are about to enter Budget Day. Though most will say that budget exercise doesn't change over macro in major way, sharpest moves of markets tend to happen prior and post budget.

To understand market moves during budget time, we have taken 5 trading days prior and 5 trading days post budget.

Nifty Moves During Budget Time....


1) Average Move During 5 days prior to budget has been 2.9%, on budget day 2.4% and 5 days post budget 4.7%.


Conclusion

Anyone talking about range bound market now is purely extrapolating recent market moves without any eye on historical market moves. Though one must say that market of late has anything but historical in terms of extreme compression. 


Thursday 14 February 2013

Chess Board With Lonely King (Nifty)


Indian market currently is comparable to a chess board albeit with only king on it. By King, I meant Nifty. Nifty is the only index which is holding on for 2013 compared to Mid-Caps and Small Caps. While, Nifty is flat for the year, Small Cap and Mid Cap Indices are down 7.7% and 9.7% respectively. Many stocks are down quite sharply between 20-40%. Betas which lead the rally post June 2012 lows have been beaten out of shape in 2013. While many are calling start of bull market with all sorts of explanation, Inter Market relationship, market breadth, etc indicates completely different story. BEGINNING OF BULL MARKETS ARE ALWAYS KNOWN IN HINDSIGHT AND CERTAINLY NOT WHEN PAID EXPERTS ON BUSINESS CHANNELS CALL FOR. 

I have already discussed in previous posts (early January 2013) volume and price action in small and mid caps was clearly indicating signs of Top. I will not venture into volume picture in this post. Rather will try to understand what can kill our last man standing i.e. Nifty. If not for strength in global markets, Nifty could be staring at very different levels.

Global picture hardly indicates RISK ON BEHAVIOR.....


1) Among the major markets considered for analysis, closer look at Top 5 performers reveals the nature of risk on behavior. For the purpose of analysis, haven't included countries like Pakistan or Greece. Pakistan for simple reason that stock market performance is linked with terrorist activity in the country. Higher the terrorism, better the performance. while countries like Greece have been omitted because Index which is down 95% from peak can be up 100% from low but it will still be down 90% from peak.

2) Out of top 5 performers, 3 are directly linked with their currency movement - Japan, UK and Switzerland. Japan is very well known story and has had more than enough share in media discussion of weak yen policy, inflation targeting blah blah. UK pound has been pounded in 2013 against USD. It is down 4.6% in 2013.

3) Swiss franc is interesting because swiss franc has been fixed vs Euro at 1.20 (in terms of floor price).  Swiss Index was clobbered from 6500 to 5000 (between June 2011-Aug 2011) with sharply appreciating swiss franc. Swiss Franc had been appreciating since onset of 2008 crisis vs Euro with gradual appreciation from 1.60 to 1.30 between Sep 2008-April 2011. However, the appreciation intensified with intensification of Euro crisis and swiss franc zoomed from 1.30 - almost 1.00 against euro by Aug 2011 (when famous floor was announced). Once floor was established currency was dead between 1.20-1.205 for entire 2012. However, during H1 Jan 2013, Swiss suddenly depreciated from 1.21 to 1.25 (big move given how stable it was during entire 2012). This resulted in large appreciate of Swiss Index.

4) Another interesting divergence since 2013 has been varied performance within indices. Leaders of rally from June lows to Dec 2012, have been lagging in 2013 (same thing within Indian market as well.....stocks which did well during June-Dec 2012 have been clobbered in 2013). Most emerging markets are struggling in 2013 or are under-performing US. It indicates either gradual tightening of liquidity (since there has to be explanation for everything...if someone is stupid, it has to be explained why is he stupid) or exhaustion of June 2012 rally.

5) Various extreme euphoric indicators are being discussed on various financial blogs and business papers with respect to US markets. I believe when indicators are so often discussed they lose their effectiveness as indicators. Despite all this, S&P has been in 1500-1520 range for last 18 trading session. 

All of the above divergences indicates, global markets could be losing their steam pretty soon. I believe it is unlikely to be a major top because major tops are associated with higher volatility. If it turns volatile, topping process will begin. 

Nifty has been quite oversold having fallen for 7 sessions out of 10 sessions in Feb 2013. Damage to Nifty has been minimal at 2.3%. Nature of fall (broader market) and global set-up indicates fall has way to go, apart from short term bounces. 

ATTACHING  LINKS WHICH HAVE ANALYZED INTER-MARKET DIVERGENCE IN US Markets. Guy (Michael Gayed) has been more right than wrong in past.

http://www.marketwatch.com/story/dow-13000-2013-01-30

http://www.marketwatch.com/story/stock-correction-deflation-and-two-scenarios-2013-02-08

http://www.marketwatch.com/story/wal-mart-indicator-warns-of-deflation-pulse-2013-02-11

http://www.marketwatch.com/story/vix-warns-nouveaux-bulls-2013-01-28


Monday 11 February 2013

Searching for Contrarian Signals for Top....will make Top Elusive


Global markets have been very resilient, particularly US markets. Most of the global markets have risen significantly since June 4, 2012, lows. After brief correction post announcement of QE Infinity, US markets have shown relentless rise, making it over bought on many parameters. (http://www.financialsense.com/contributors/carl-swenlin/very-overbought-market)

After such rise one would expect typical "this time is different" stories to emerge or for lack of explanation there is "huge liquidity" driving markets higher type of explanation. Though occasionally we hear liquidity explanation from "experts" with data saying otherwise (http://www.mcoscillator.com/learning_center/weekly_chart/ecbs_shrinking_balance_sheet/) , only new story to have emerged to provide explanation for relentless rise in market is "Rotation Story - from bonds to equities". 

I have no understanding of how one arrive at such conclusion nor will I try to do so. But more than this time is different stories....most experts or otherwise have tried to find various contrarian signals which might suggest topping of the market. BEST PART OF CONTRARIAN SIGNAL IS LESS THEY ARE DISCUSSED MORE EFFECTIVE THEY BECOME. Unfortunately, since dow has attempted to breach 14k and S&P breached 1500....many stories have emerged discussing how many signals/indicators are flashing contrarian sells. MAJOR TOPS ARE ONLY MADE WHEN "THIS TIME IS DIFFERENT" STORIES OUTWEIGHS "SEARCHING FOR CONTRA SELL SIGNAL" STORIES.

Below, I will provide link to various articles from blogs and sites which have provided charts/indicators as contra sells.


  1. http://www.marketwatch.com/story/insiders-now-aggressively-bearish-2013-02-06 (Marketwatch 6th Feb 2013)
  2. http://www.businessinsider.com/bofa-were-in-the-1-percent-of-investor-bullishness-2013-2 (Business Insider 11th Feb 2013)
  3. http://www.sentimentrader.com/subscriber/comments/2013/sentiment_report_20130206.php (6 Feb 2013)
  4. http://www.zerohedge.com/news/2013-02-06/euphoria (6th Feb 2013)
  5. http://cdroke.blogspot.in/2013/01/investor-sentiment-becoming-bubbly.html (30th Jan 2013)


Many other sites have been flashing various contra sells discussing high insider selling, low VIX, AAII and other surveys, etc.

The only thing I can conclude is correction is more likely outcome than forming major top just yet.

Saturday 9 February 2013

Domestic Sentiment Subsides....Global Markets Key Now


Mid-Cap and Small Caps have corrected significantly since the below 2 posts were made.
http://speculationanart.blogspot.in/2013/01/nifty-mid-cap-volumes-tell-different.html (Date - 7 Jan 2013) 
http://speculationanart.blogspot.in/2013/01/small-mid-cap-froth-adds-to-nifty-worry.html (Date - 9 Jan 2013)


Mid-Cap (NSE Mid Cap 50 Index) is down 5.7% and NSE Small Cap is down 10% since 7th Jan 2013. Primary reason for calling for caution which was discussed in those posts was as follow....


  • Once a price trend has been in place, spike in volumes typically indicates end of trend (short/medium or long term). On other hand, spike in volumes in flat to downward market is typically sign of new trend.

  • Typically prior to peaks volumes are much lower with sudden burst in volumes. Post peaks volumes again tappers off and comes back to pre peak levels.


The above points can help significantly in identifying intermediate tops. Let see what has happened to volumes and price action since then.


1) Both NSE Mid Cap and NSE Small cap peaked with burst in volumes. Small cap peaked in Dec 2012 while Mid Cap peaked in Jan in terms of daily average volumes. Please refer previous posts to compare how were both indices were positioned then. (Jan 7 and Jan 9 2013)

2) Previous 2 posts clearly indicated behavior of "all in" among local participants and since then price behavior has deteriorated.

Having seen deterioration in small and mid cap in terms of price, we will also see how EXPERT views are positioned NOW compared to start of December 2012 and January 2013. As we have seen through previous post (http://speculationanart.blogspot.in/2013/01/market-turning-points-and-expert-views.html), expert views are one of the greatest contrarion indicator. 3 year old kid has higher probability to succeed in markets than these experts...simply because his probability to succeed is 50% while experts probability to fail is close to 100%. Experts turning out to be right is BLACK SWAN event. 

Before we get into summary of expert views....we need to understand price behavior of Nifty prior to collection of those views. This is because expert views are primarily derived recent price action.

Nifty Price Action during Sep-Nov 2012


1) QE week (Quantitative Easing announcement week) accounted for 6.3% of move in Nifty in Sep 2012.

EXPERT HELP....
Expert Views @ the start of December 2012 (1st week of December 2012)


  1. See Nifty at 6350 if govt wins FDI vote: Ajay Srivastava (CNBC...3rd Dec 2012)
  2. Nifty may end December F&O series at 6070-6120: IIFL (CNBC...3rd Dec 2012)
  3. Mkt holds upside surprise; FIIs go long: PhillipCapital (CNBC....4th Dec 2012)
  4. See strong up trending mkt; go long: Sudarshan Sukhani (CNBC....4th Dec 2012)
  5. See Bank Nifty hitting lifetime highs before Nifty: JM Fin (CNBC....5th Dec 2012)
  6. Market on a roll; Nifty may hit previous high soon: Experts (CNBC....5th Dec 2012)
  7. Brace for 21000, don't wait for correction: Ramesh Damani (CNBC....7th Dec 2012)
  8. Sensex may see 22000 by March 2013: Sanju Verma (CNBC....7th Dec 2012)
Since Most experts were bullish and Dec 2012 received 3rd Highest Monthly FII inflow ever, NIFTY ZOOMED by 0.4%. 

Expert Views @ the start of December 2012 (1st week of Jan 2013)


  1. US, Europe sideshows; domestic boom to rule 2013: PN Vijay (CNBC....1st Jan 2013)
  2. Nifty on verge of breakout; go long above 5920: Sukhani (CNBC....1st Jan 2013)
  3. See Nifty at 7500 if 6300 breached decisively: Darashaw (CNBC....1st Jan 2013)
  4. Mkt to remain buoyant for first quarter of 2013: Edelweiss (CNBC....1st Jan 2013)
  5. Nifty to make new highs after taking out 6000: Baliga (CNBC....3rd Jan 2013)
  6. Mkt trend upwards; buy on dips, don't short sell: Sukhani (CNBC....4th Jan 2013)
  7. Mkt set-up strong; resistance for Nifty at 6080: Manghnan (CNBC....4th Jan 2013)


Since Sky was the limit for experts and poured in Rs 22k cr, Nifty exploded by 2.2% outperforming most global markets which were up anywhere between 5-9%. 

Nifty started 2013 @ 5905 and 8th Feb 2013 close was 5904....FII inflow close to Rs 55kcr in 2013 (I have no idea if FII inflow is anyway linked to Nifty movement...but I am carrying out general practice here)...Since Sep 2012 end (Month of Nifty break-out), Nifty is up massive 3.5% and FII inflow of close to Rs 75kcr. NSE Mid Cap Index is down 1.1%  and NSE Small Cap Index is up 1.5% since Sep 2012 end.  Such performance should logically result in some sort of tired feeling among experts who drives only with rear-view mirror. 

Expert Views Now....


  1. Mkt inching to 5780-5800, use rallies to short: Sukhani (CNBC....8th Feb 2013)
  2. See mkt at 5840-5850; cautious of SBI : Ambareesh Baliga (CNBC....8th Feb 2013)
  3. Buy Infosys, short Nifty for good hedge: ICICI Direct (CNBC....8th Feb 2013)
  4. Nifty can decline to 5762-5750 in 2 wks: Mitesh Thacker (ET Now...9th Feb 2013)
  5. Nifty gives bulls have a few things to worry about (www.firstpost.com......9th Feb 2013)


The above clearly indicates local factors are clearly tired...Reform push and all other "sentimentally" positive news have failed to show in Nifty performance. Worse part is Nifty has significantly unperformed most global markets since last 2-3 months. SO IN TERMS OF SENTIMENT, LOCAL SENTIMENTS ARE DOWN SIGNIFICANTLY WHICH SHOULD LIMIT DOWNSIDE IN NIFTY....ONLY THING THAT CAN CREATE FURTHER DOWNSIDE IN MARKET IS GLOBAL FACTORS...


Monday 4 February 2013

NIFTY WALKING ON THIN ICE AND ICE MELTS.....


BIGGER MOVES AND BIGGER VOLUMES ALWAYS HAPPEN AT INFLECTION POINTS.....
O Ashuji....

Nifty Walking on Thin Ice and Ice Melts.....

http://www.speculationanart.blogspot.in/2013/01/nifty-labored-move-and-walking-on-thin.html (BLOG DATED 29TH Jan, 2013)

Though Nifty has been having labored move as discussed in previous 2 blogs and breadth has been very worrying during those moves, 2 things happened on 4th Feb, 2013, which makes Ice Melting under Nifty's Labored move.

1) Sharp Shrinkage in Nifty Premium
2) Put IV's jumps 4 points higher than Call IVs


Nifty Premium/Discount Since 2012


1) Premium typically builds after move has started and expands towards the end of the move.

2) Nifty enjoyed 16% return during Jan-Feb 2012 (such sharp move came after end of world sentiment during Aug-Dec 2011). Premiums were subdued during the rise, while they expanded after the move was largely over. At the start of March 2012 expiry, premiums expanded from 25odd points in February to 50odd points. With subdued March (down 1%) premiums stabilized @ 25-30pts during April 2012 expiry.

3) Nifty Premium went to discount in 2nd half of May 2012 expiry because of sharp fall in H1 May 2012 (down 5.4% by 11th May 2012)

4) Nifty along with world markets bottomed on 4th June 2012. As discussed earlier, premium typically builds once the move has started. Nifty turned to returned to premium by July 2012.

5) Since, July 2012 premiums has been steady to gradually expanding reaching peak in Jan 2013 of 45-50 points in early part of Jan 2012 expiry.

6) Feb 2013 series started with premium of 37 points. However, premium shrunk to 9 points on 4th Feb 2013 (2nd day of expiry). This is fall of 28 points in Nifty premium (sharpest single day fall in premium). Also, first time since July 2012, Nifty premium has gone to single digit in first week of expiry. 

ABOVE ANALYSIS CONSIDERS ONLY H1 OF EXPIRY SINCE PREMIUM GRADUALLY SHRINKS AND APPROACHES SPOT NIFTY TOWARDS  DURING H2 OF EXPIRY. 

OPTION IMPLIED VOLATILITY (IVs) (FEB 2013 EXPIRY)

1) Call and Put IVs were similar through Dec-Jan and were similar till few days back. However, gap has increased significantly to 4 points now in past few days.


Conclusion

The above indicates that positioning is now building on the short side and we could have lower move now sooner (as most other indicators have been pointing but price was not reflecting). 


Friday 1 February 2013

$8.6bn buys 2.6% of Nifty Move

Dec 2012 and Jan 2013 have been historic in so many ways -

1) These 2 months received 2nd highest FII inflow around Rs 47kcr (approx $8.6bn). Highest inflow months were Sep-Oct 2010, right at the time of announcement of QE2 (Rs 53k cr).

2) With 2nd highest FII inflow (on 2 month basis), Dec 2012 and Jan 2013 were the most compressed months in Nifty's history as measured by High-Low range and number of days with 1% Nifty move. There were ONLY 2 DAYS with 1% move in Dec 2012 and Jan 2013.

3) During last 2 months Nifty moved by 2.6% vs 12% during Sep-Oct 2010 (highest ever FII inflow months)

I am in no way trying to establish any kind of relationship between FII inflows and Nifty returns. Cause-Effect relationship is applied for intellectual satisfaction. Only thing constant is nature of price move and CLUSTERING. There are times when FII inflows are negative and Nifty return is positive and vice-versa. Though reasoning will be ready for both scenario by Fundamental Analysts. The reason I have put down above 3 points is to show how compression is getting clustered which should lead to clustering of volatility. For me Volatility is bigger move in prices. I will later show, that last 3 years (2010, 2011 and 2012) have been extremely compressed for Nifty (they can be termed range-bound...but even within range moves have been very small). So even on yearly basis there has been clustering of compression which should lead to higher moves over coming years.

Measuring Volatility in Nifty Through Daily Moves


No days with % move in Nifty
1) 2012 had ZERO days with >3% move. 

2) Last 3 years have been extremely compressed in terms of daily moves in Nifty. Such Compressed period will certainly be followed by big daily moves. 


Chart Presentation of the above data


Number of Days with >1% Move in Nifty


Net FII Inflow (Rs cr)


Will comment on Clustering of FII Flows in next post...It will be purely on nature of clustering of flows...nothing on cause effect relationship.